Mentor Trees - Data Visualization
Submission for IEEE VISAP 2022

Check out our sick website! https://www.mentortrees.com
Repo https://github.com/zengjilie/mentortree
Introduction
Submission for IEEE VISAP 2022.
Topics: Storytelling, Gender Equity,Gender in Academia.
I am responsible for the tree visualization :)
Tech Stack
-
Frontend: P5JS
-
Backend: ExpressJS, Docker
Data Source
From https://github.com/JialingJia/scimap-FA-2021/tree/main/mentorship/data/tree%20candidate by Houjiang Liu.
Installation
If you use NPM, you can
git clone this repo -> npm install -> npm start -> Listening to PORT 5000
Else if you use Docker, you can
Go to Dockerfile -> use FROM node:16-alpine instead of the linux one -> build the docker image docker build . -t mentor-tree -> run the image inside a container called “mentor-tree” docker run -p 5000:5000 --name mentor-tree mentor-tree -> stop running docker stop mentor-tree
Design Doc
Preprocessor
-
Objectives:
- Map
children_numtoweightfor each researcher. - Apply new
gender_color.
- Map
-
File:
preprocessor.js -
Steps
- Use a recursive function to traverse all the researchers. When traversing a researcher ->
- Assign him/she/unknown a new
gender_color. - Add his/her/unknown’s
research_areato a SET. - Store the
researcher_nameand his/her/unknown’schildren_numto a MAP.
- Assign him/she/unknown a new
- Use a recursive function to traverse all the researchers. When traversing a researcher ->
-
Calculate the
weightof each researchersum = sum up all children_num in the MAP max = maximum children number in the MAP min = minimum children number in the MAP range_mean = (max - min) / 2 -
Oversampling / Undersampling
If we plot each researcher using their original
weightwithout doing oversampling / undersampling.The proportion of the tree will be extremely imbalanced and weird.
To avoid this situation, we need to perform oversampling / undersampling on each researcher’s
children_num.weight = w children_num = cn range_mean = rm i = random researcher i|- Original Weight w_i = cn_i / sum |- New Weight w_i = [cn_i - |cn_i - rm| * 0.1] / sum , (cn_i > rm) cn_i / sum , (cn_i = rm) [cn_i + |cn_i - rm| * 0.1] / sum , (cn_i < rm)
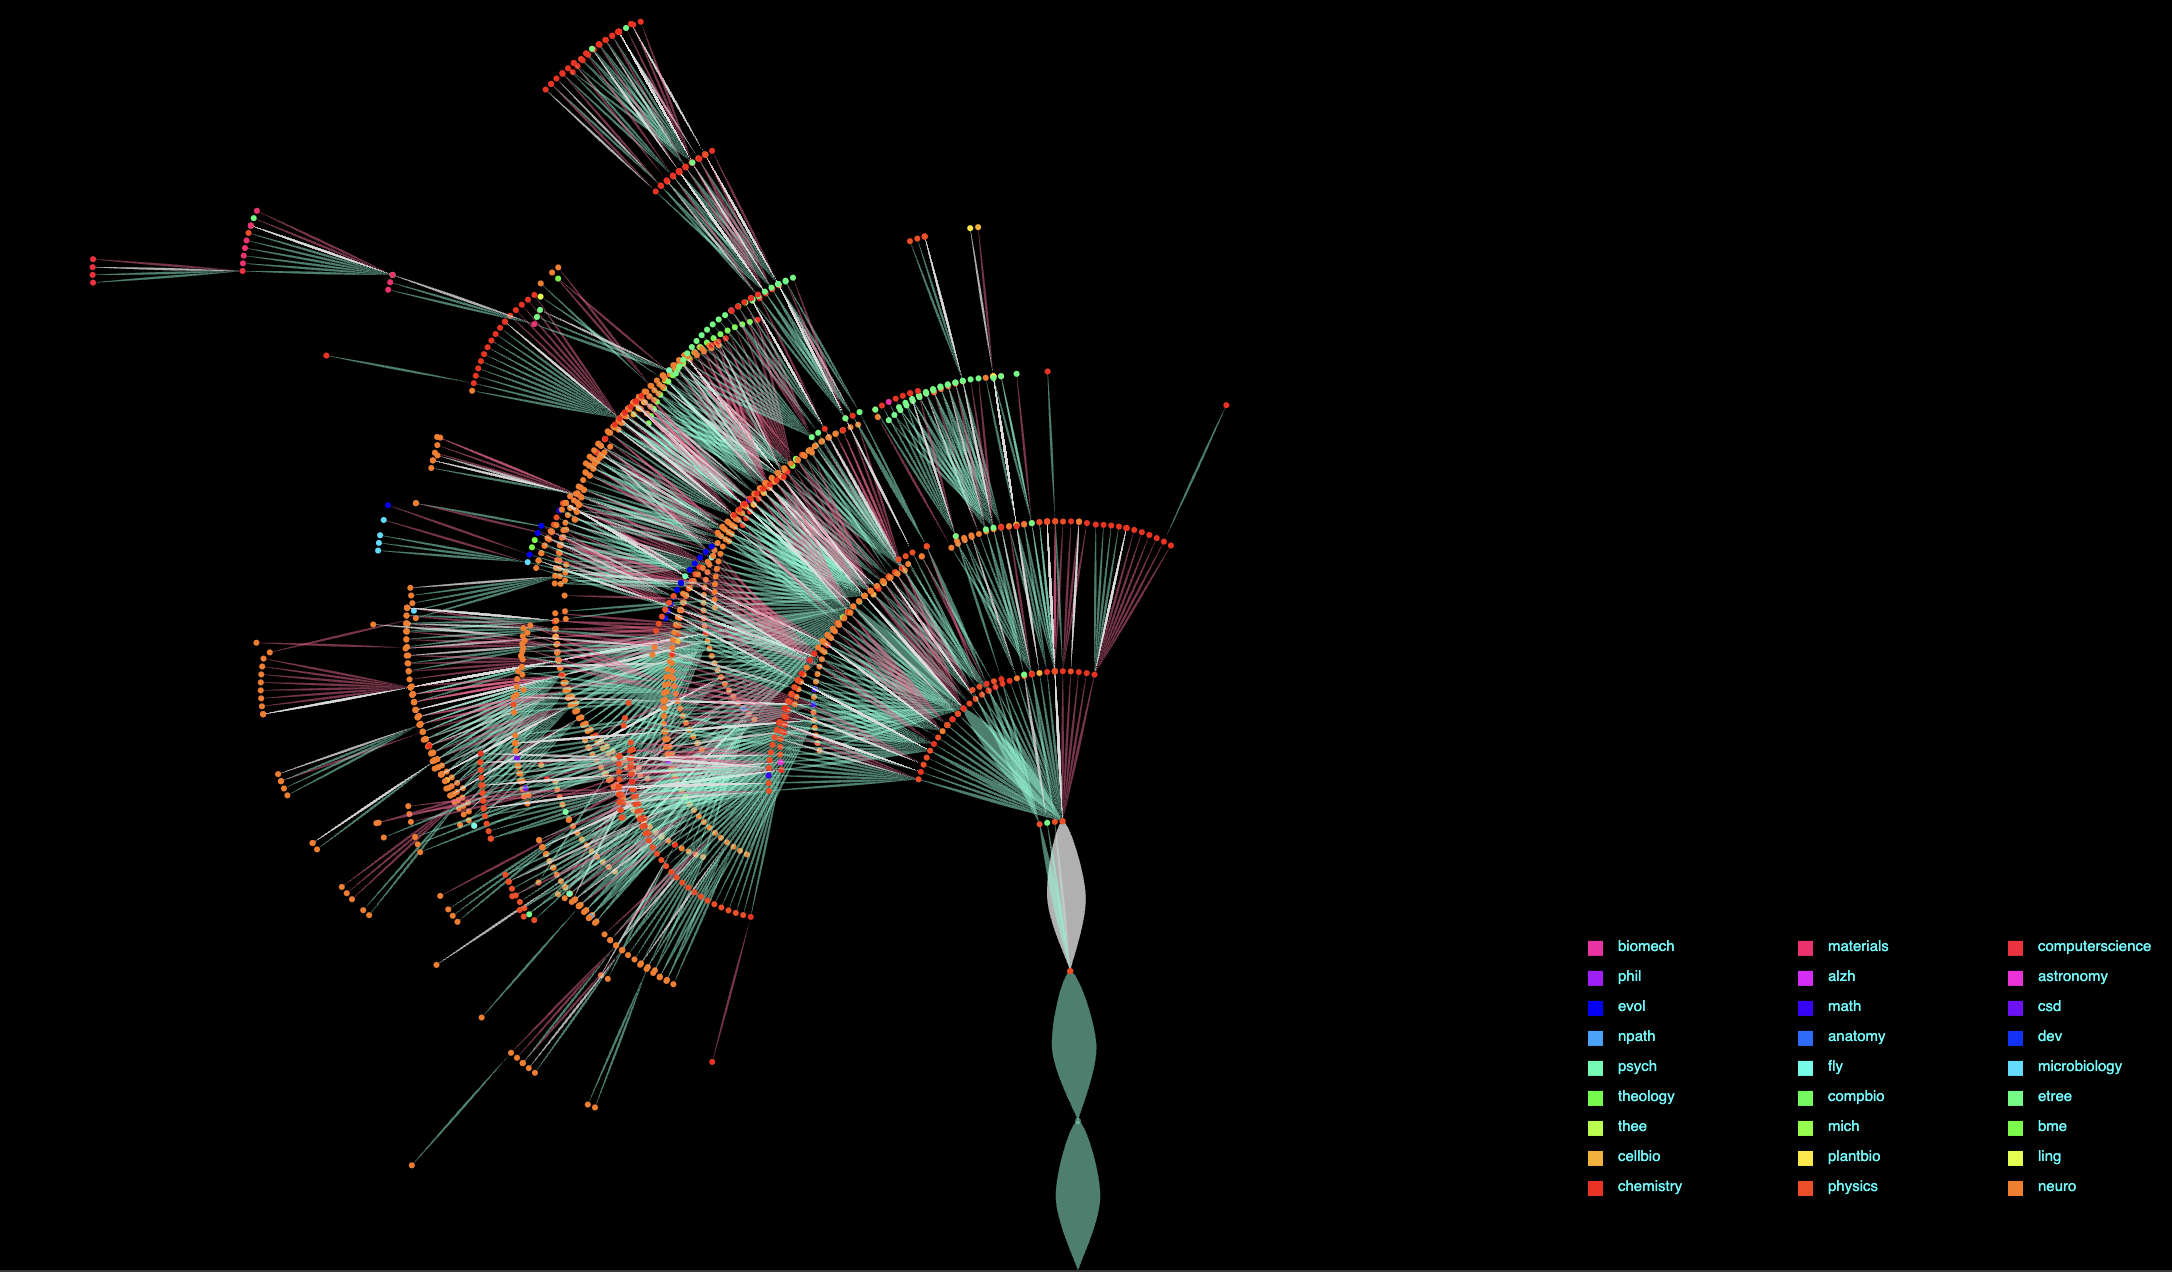
Tree Implementation
-
Objectives: Just plot the tree in p5
-
File:
tree.js -
Steps
-
Use the HSB color system to assign each
research_areaa unique hue value. -
Use a recursive function to traverse all the researchers, when traversing a researcher ->
-
Draw his/her/unknown
research_area(just a dot) -
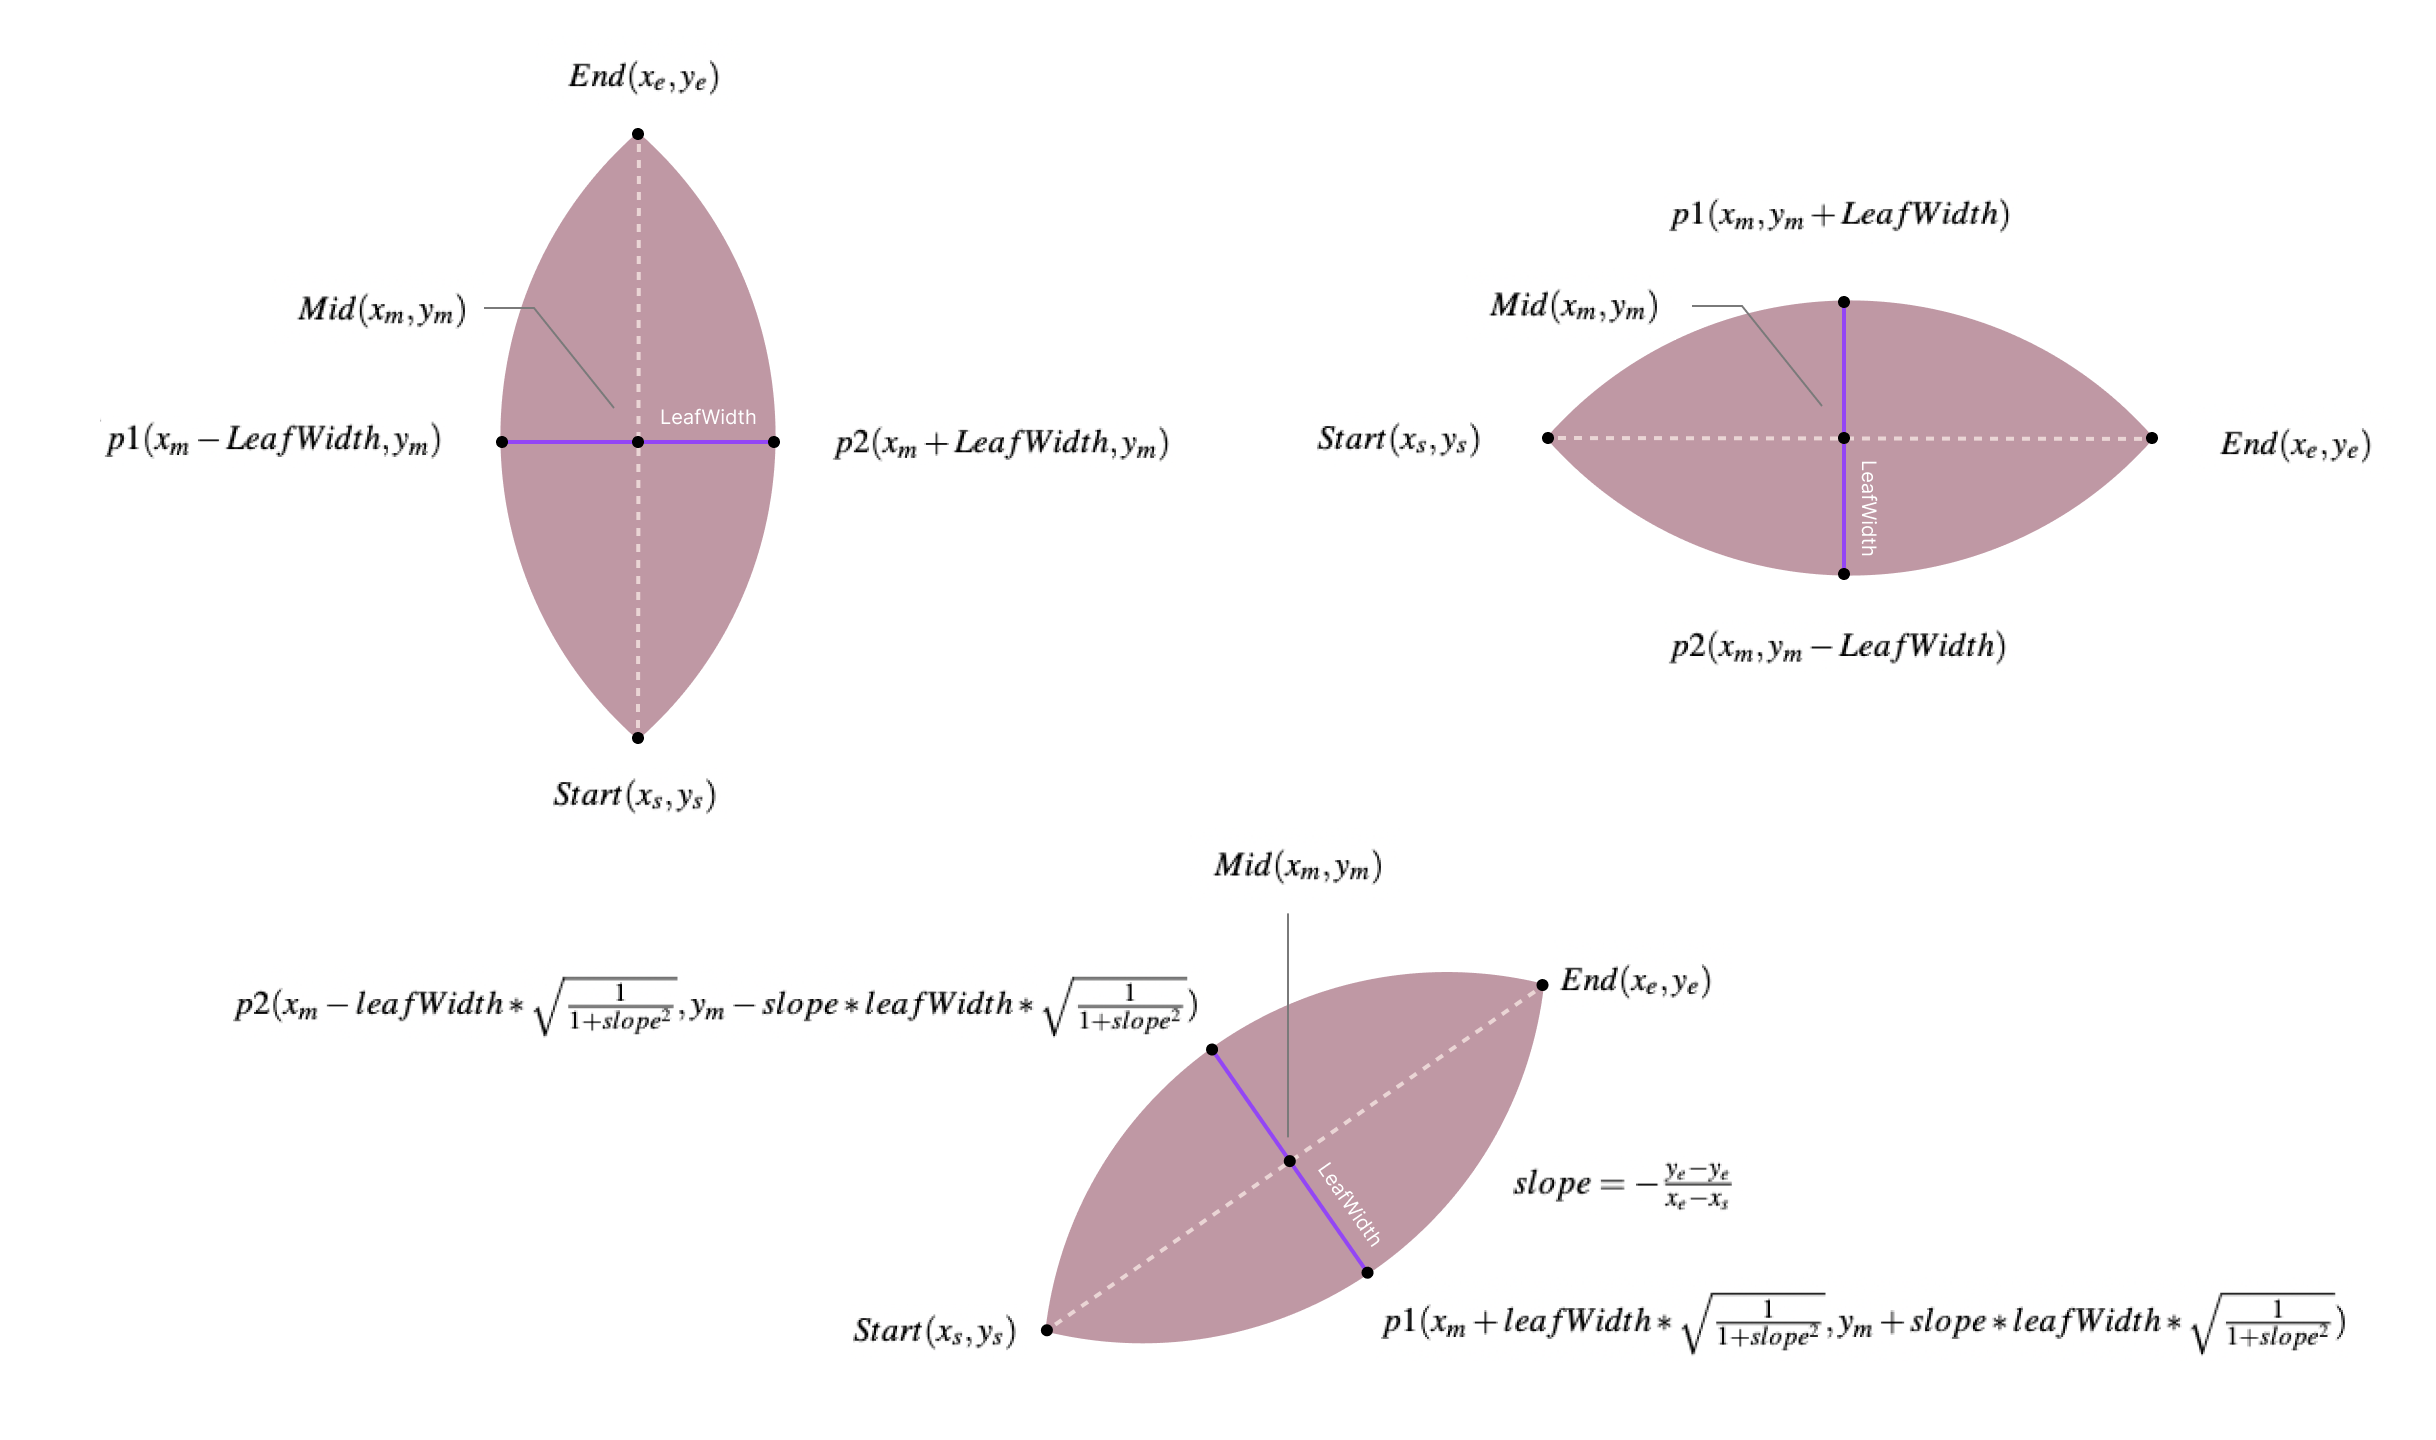
Draw the leaf using the following equation (easy peasy)

leaf -
If it’s a her -> tilt right, him -> tilt left, unknow -> none tilt
WILLIAM SPENCER HUTCHINSON
-
-